学习网址:http://kibana.logstash.es/content/logstash/get_start/index.html
日志的分析和监控在系统开发中占非常重要的地位,系统越复杂,日志的分析和监控就越重要,常见的需求有:
-
根据关键字查询日志详情
-
监控系统的运行状况
-
统计分析,比如接口的调用次数、执行时间、成功率等
-
异常数据自动触发消息通知
-
基于日志的数据挖掘
很多团队在日志方面可能遇到的一些问题有:
-
开发人员不能登录线上服务器查看详细日志,经过运维周转费时费力
-
日志数据分散在多个系统,难以查找
-
日志数据量大,查询速度慢
-
一个调用会涉及多个系统,难以在这些系统的日志中快速定位数据
-
数据不够实时
常见的一些重量级的开源Trace系统有
这些项目功能强大,但对于很多团队来说过于复杂,配置和部署比较麻烦,在系统规模大到一定程度前推荐轻量级下载即用的方案,比如logstash+elasticsearch+kibana(LEK)组合。
对于日志来说,最常见的需求就是收集、查询、显示,正对应logstash、elasticsearch、kibana的功能。
logstash

logstash部署简单,下载一个jar就可以用了,对日志的处理逻辑也很简单,就是一个pipeline的过程
inputs >> codecs >> filters >> outputs
对应的插件有

从上面可以看到logstash支持常见的日志类型,与其他监控系统的整合也很方便,可以将数据输出到zabbix、nagios、email等。
推荐用redis作为输入缓冲队列。
你还可以把数据统计后输出到graphite,实现统计数据的可视化显示。
参考文档
elasticsearch

elasticsearch是基于lucene的开源搜索引擎,近年来发展比较快,主要的特点有
-
real time
-
distributed
-
high availability
-
document oriented
-
schema free
-
restful api
elasticsearch的详细介绍以后再写,常用的一些资源如下
中文
smartcn, ES默认的中文分词
https://github.com/elasticsearch/elasticsearch-analysis-smartcn
mmseg
https://github.com/medcl/elasticsearch-analysis-mmseg
ik
https://github.com/medcl/elasticsearch-analysis-ik
pinyin, 拼音分词,可用于输入拼音提示中文
https://github.com/medcl/elasticsearch-analysis-pinyin
stconvert, 中文简繁体互换
https://github.com/medcl/elasticsearch-analysis-stconvert
常用插件
elasticsearch-servicewrapper,用Java Service Wrapper对elasticsearch做的一个封装
https://github.com/elasticsearch/elasticsearch-servicewrapper
Elastic HQ,elasticsearch的监控工具
http://www.elastichq.org
elasticsearch-rtf,针对中文集成了相关插件(rtf = Ready To Fly)
https://github.com/medcl/elasticsearch-rtf
作者主页
kibana

kibana是一个功能强大的elasticsearch数据显示客户端,logstash已经内置了kibana,你也可以单独部署kibana,最新版的kibana3是纯html+js客户端,可以很方便的部署到Apache、Nginx等Http服务器。
kibana3的地址: https://github.com/elasticsearch/kibana
kibana2的地址: https://github.com/rashidkpc/Kibana
kibana3 demo地址: http://demo.kibana.org
从demo可以先看一下kibana的一些基本功能
图表

数据表格,可以自定义哪些列显示以及显示顺序

可以看到实际执行的查询语句

新加一行

新加panel,可以看到支持的panel类型

加一个饼图

用地图显示统计结果

按照http response code来统计

丰富的查询语法

安装部署
下面列一下一个简易LEK体验环境的搭建步骤
安装jdk 1.7
省略安装过程,推荐1.7+版本
java -version
设置java的环境变量,比如
sudo vim ~/.bashrc

>>
export JAVA_HOME=/usr/lib/jvm/java-7-oracle
export JRE_HOME=${JAVA_HOME}/jre
export CLASSPATH=.:${JAVA_HOME}/lib:${JRE_HOME}/lib
export PATH=${JAVA_HOME}/bin:$PATH
>>

source ~/.bashrc
安装redis
cd ~/src
wget http://download.redis.io/releases/redis-2.6.16.tar.gz
tar -zxf redis-2.6.16.tar.gz
cd redis-2.6.16
make
sudo make install
可以通过redis源代码里utils/install_server下的脚本简化配置工作
cd utils
sudo ./install_server.sh
install_server.sh在问你几个问题后会把redis安装为开机启动的服务,可以通过下面的命令行来启动/停止服务
sudo /etc/init.d/redis_ start/end
启动redis客户端来验证安装
redis-cli
> keys *
安装Elasticsearch
cd /search
sudo mkdir elasticsearch
cd elasticsearch
sudo wget http://download.elasticsearch.org/elasticsearch/elasticsearch/elasticsearch-0.90.5.zip
sudo unzip elasticsearch-0.90.5.zip
elasticsearch解压即可使用非常方便,接下来我们看一下效果,首先启动ES服务,切换到elasticsearch目录,运行bin下的elasticsearch
cd /search/elasticsearch/elasticsearch-0.90.5
bin/elasticsearch -f
访问默认的9200端口
curl -X GET http://localhost:9200
安装logstash
cd /search
sudo mkdir logstash
cd logstash
sudo wget http://download.elasticsearch.org/logstash/logstash/logstash-1.2.1-flatjar.jar
logstash下载即可使用,命令行参数可以参考logstash flags,主要有
agent   #运行Agent模式
-f CONFIGFILE #指定配置文件

web     #自动Web服务
-p PORT #指定端口,默认9292
安装kibana
logstash的最新版已经内置kibana,你也可以单独部署kibana。kibana3是纯粹JavaScript+html的客户端,所以可以部署到任意http服务器上。
cd /search
sudo mkdir kibana
sudo wget http://download.elasticsearch.org/kibana/kibana/kibana-latest.zip
sudo unzip kibana-latest.zip
sudo cp -r  kibana-latest /var/www/html
可以修改config.js来配置elasticsearch的地址和索引。
用浏览器访问试试看 http://127.0.0.1/html/kibana-latest/index.html
集成
把上面的系统集成起来
首先把redis和elasticsearch都启动起来
为logstash新建一个配置文件
cd /search/logstash
sudo vi redis.conf
配置文件内容如下
input {
  redis {
    host => "127.0.0.1"
    port => "6379"
    key => "logstash:demo"
    data_type => "list"
    codec  => "json"
    type => "logstash-redis-demo"
    tags => ["logstashdemo"]
  }
}

output {
  elasticsearch {
    host => "127.0.0.1"
  }

}
用这个配置文件启动logstash agent
java -jar /search/logstash/logstash-1.2.1-flatjar.jar agent -f /search/logstash/redis.conf &
启动logstash内置的web
java -jar /search/logstash/logstash-1.2.1-flatjar.jar web &
查看web,应该还没有数据
http://127.0.0.1:9292
在redis 加一条数据
RPUSH logstash:demo "{\"time\": \"2013-01-01T01:23:55\", \"message\": \"logstash demo message\"}"
看看elasticsearch中的索引现状
curl 127.0.0.1:9200/_search?pretty=true

curl -s http://127.0.0.1:9200/_status?pretty=true | grep logstash
再通过logstash web查询一下看看
http://127.0.0.1:9292
通过单独的kibana界面查看
http://127.0.0.1/html/kibana-latest/index.html#/dashboard/file/logstash.json
数据清理
logstash默认按天创建ES索引,这样的好处是删除历史数据时直接删掉整个索引就可以了,方便快速。
elasticsearch也可以设置每个文档的ttl(time to live),相当于设置文档的过期时间,但相比删除整个索引要耗费更多的IO操作。
索引
elasticsearch默认会按照分隔符对字段拆分,日志有些字段不要分词,比如url,可以为这类字段设置not_analyzed属性。
设置multi-field-type属性可以将字段映射到其他类型。multi-field-type。
大量日志导入时用bulk方式。
对于日志查询来说,filter比query更快 过滤器里不会执行评分而且可以被自动缓存。query-dsl。
elasticsearch默认一个索引操作会在所有分片都完成对文档的索引后才返回,你可以把复制设置为异步来加快批量日志的导入。
elasticsearch 优化
优化JVM
优化系统可以打开最大文件描述符的数量
适当增加索引刷新的间隔
最佳实践
-
首先你的程序要写日志
-
记录的日志要能帮助你分析问题,只记录"参数错误"这样的日志对解决问题毫无帮助
-
不要依赖异常,异常只处理你没考虑到的地方
-
要记录一些关键的参数,比如发生时间、执行时间、日志来源、输入参数、输出参数、错误码、异常堆栈信息等
-
要记录sessionid、transitionid、userid等帮你快速定位以及能把各个系统的日志串联起来的关键参数
-
推荐纯文本+json格式
-
使用队列
其他日志辅助工具
_ueditor_page_break_tag_ Logstash是一个完全开源的工具,他可以对你的日志进行收集、分析,并将其存储供以后使用(如,搜索),您可以使用它。说到搜索,logstash带有一个web界面,搜索和展示所有日志。
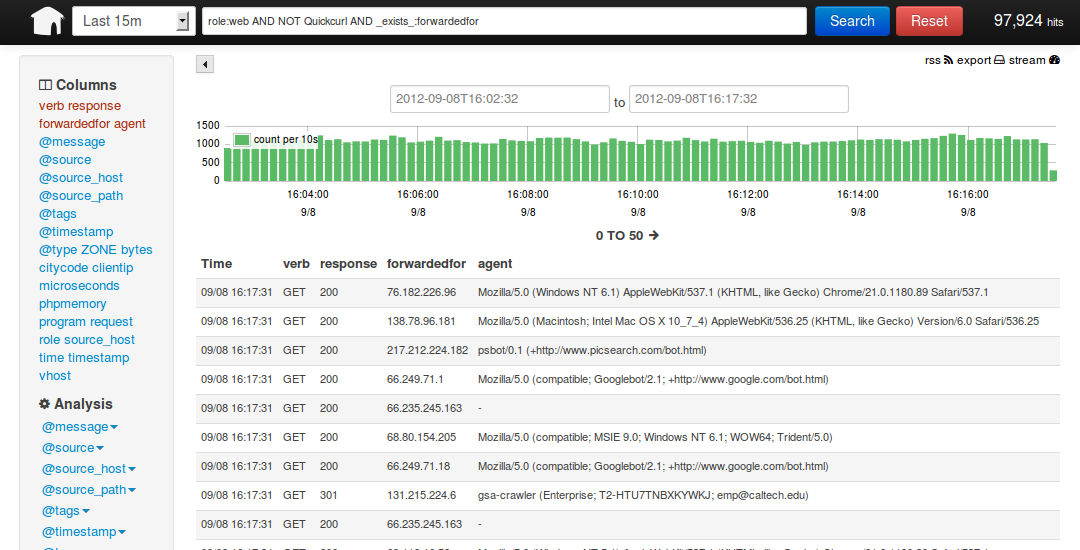
kibana 也是一个开源和免费的工具,他可以帮助您汇总、分析和搜索重要数据日志并提供友好的web界面。他可以为 Logstash 和 ElasticSearch 提供的日志分析的 Web 界面
说到这里,我们看看 kibana 和 logstash到底能为我们做些什么呢?下面是kibana的界面
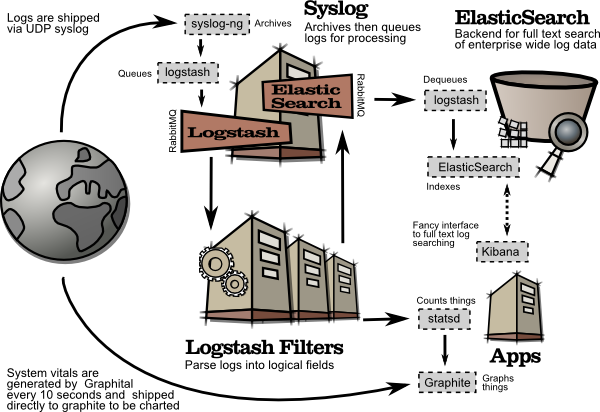
简单来讲他具体的工作流程就是 logstash agent 监控并过滤日志,将过滤后的日志内容发给redis(这里的redis只处理队列不做存储),logstash index将日志收集在一起交给
全文搜索服务ElasticSearch 可以用ElasticSearch进行自定义搜索 通过Kibana 来结合 自定义搜索进行页面展示,下图是 Kibana官网上的流程图
好了 让我们一步步的把这套环境搭建起来吧,先看看都需要安装什么软件包
ruby 运行Kibana 必须,
rubygems 安装ruby扩展必须
bundler 功能类似于yum
JDK 运行java程序必须
redis 用来处理日志队列
logstash 收集、过滤日志
ElasticSearch 全文搜索服务(logstash集成了一个)
kibana 页面展示
这里有三台服务器
192.168.233.128 logstash index,ElasticSearch,kibana,JDK
192.168.233.129 logstash agent,JDK
192.168.233.130 redis
首先到 logstash index服务器上面,logstash分为 index和aget ,agent负责监控、过滤日志,index负责收集日志并将日志交给ElasticSearch 做搜索
此外 logstash 的收集方式分为 standalone 和 centralized。
standalone 是所有功能都在一个服务器上面,自发自收,centralized 就是集中收集,一台服务器接收所有shipper(个人理解就是logstash agent)的日志。
其实 logstash本身不分 什么 shipper 和 collector ,只不过就是配置文件不同而已,我们这次按照集中的方式来测试
在 logstash index上安装基础的软件环境
[192.168.233.128 root@nodec:~]
# cd /soft/
[192.168.233.128 root@nodec:/soft]
# wget http://down1.chinaunix.net/distfiles/jdk-6u13-dlj-linux-i586.bin
从oracle下载实在是太慢了,从CU下载会快一些,如果需要最新版本请访问这里
http://www.oracle.com/technetwork/java/javase/downloads/jdk7-downloads-1880260.html
[192.168.233.128 root@nodec:/soft]
# sh jdk-6u13-dlj-linux-i586.bin
输入yes 便开始安装了
安装完成后设置一下 JAVA_HOME
[192.168.233.128 root@nodec:/soft/Kibana-0.2.0]
# vim /etc/profile
export JAVA_HOME=/usr/java
export PATH=$JAVA_HOME/bin:$PATH
export CLASSPATH=.:$JAVA_HOME/lib/tools.jar:$JAVA_HOME/lib/dt.jar:$CLASSPATH
安装ruby 就比较简单了(Kibana需要ruby 1.8.7以上版本)
[192.168.233.128 root@nodec:/soft]
# yum install ruby rubygems
….. 安装内容省略
安装完成后用 rubygems 来安装bundler
[192.168.233.128 root@nodec:/soft]
# /usr/bin/gem install bundler
…..
ok 这样基本的环境就已经有了,下面就是安装kibana 和 logstash
其实logstash 就是一个java脚本,不需要安装… 下载即用
[192.168.233.128 root@nodec:/soft]
# wget http://logstash.objects.dreamhost.com/release/logstash-1.1.0-monolithic.jar
现在看看 这个脚本应该怎么去执行
[192.168.233.128 root@nodec:/soft]
# java -jar /soft/logstash-1.1.0-monolithic.jar -h
No such command "-h"
Available commands:
-v
-V
–version
agent
web
test
显然没有 -h 参数,不过列出了能用的参数,但是logstash的参数可不止这些,
java -jar /soft/logstash-1.1.0-monolithic.jar agent –help
这些是在agent模式下的命令参数
-f, –config CONFIGFILE
Load the logstash config from a specific file, directory, or a wildcard. If given a directory or wildcard, config files will be read in order lexigraphically.
-e CONFIGSTRING
Use the given string as the configuration data. Same syntax as the config file. If not input is specified, 'stdin { type => stdin }' is default. If no output is specified, 'stdout { debug => true }}' is default.
-w, –filterworks COUNT
Run COUNT filter workers (default: 1)
–watchdog-timeout TIMEOUT
Set watchdog timeout value.
-l, –log FILE
Log to a given path. Default is to log to stdout
-v
Increase verbosity. There are multiple levels of verbosity available with '-vv' currently being the highest
–pluginpath PLUGIN_PATH
A colon-delimted path to find other logstash plugins in
java -jar /soft/logstash-1.1.0-monolithic.jar web –help
下面的是在web界面的参数
–log FILE
Log to a given path. Default is stdout.
–address ADDRESS
Address on which to start webserver. Default is 0.0.0.0.
–port PORT
Port on which to start webserver. Default is 9292.
-B, –elasticsearch-bind-host ADDRESS
Address on which to bind elastic search node.
-b, –backend URL
The backend URL to use. Default is elasticsearch:/// (assumes multicast discovery). You can specify elasticsearch://[host][:port]/[clustername]
如果上面的这些命令都能执行正常的话就表示 logstash可以使用了,但要让他启动还需要一个配置文件
[192.168.233.128 root@nodec:/soft]
# vim redis.conf
input {
redis {
host => '192.168.233.130'
data_type => 'list'
port => "6379"
key => 'logstash:redis'
type => 'redis-input'
}
}
output {
elasticsearch {
embedded => true
}
}
解释一下 logstash的配置文件由 input filter output 等几个基本的部分组成,顾名思义 input 就是在那收集数据,output就是输出到哪,filter代表一个过滤规则意思是什么内容
会被收集。
上面这段是让 logstash 去192.168.233.130 这个redis服务器上去收集日志 redis端口为6379,key是 logstash:redis 类型为 redis-input ,(注意:这几个值必须跟logstash agent的
output 所对应),收集完成后输出到 elasticsearch ,embedded => true 的意思是使用logstash 内嵌的 elasticsearch。如果有独立的elasticsearch服务器,需要将 这条改为
host => 'elasticsearch的ip' port => 端口
好了,这个简单的配置文件可以让logstash开始启动了
[192.168.233.128 root@nodec:/soft]
# java -jar /soft/logstash-1.1.0-monolithic.jar agent -f /soft/redis.conf — web –backend elasticsearch:///?local &
[1] 5205
…这里要等待约5秒钟… 为什么?去问开发者吧
[192.168.233.128 root@nodec:/soft]
# I, [2013-03-19T03:23:10.749000 #5205] INFO — : Using beta plugin 'redis'. For more information about plugin statuses, see http://logstash.net/docs/1.1.0/plugin-status {"timestamp":"2013-03-19T03:23:10.732000 -0700","message":"Using beta plugin 'redis'. For more information about plugin statuses, see http://logstash.net/docs/1.1.0/plugin-status ","level":"info"}
file:/soft/logstash-1.1.0-monolithic.jar!/gems/rack-1.3.4/lib/rack/backports/uri/common_192.rb:53 warning: already initialized constant WFKV_
Mizuno 0.5.0 (Jetty 8.0.y.z-SNAPSHOT) listening on 0.0.0.0:9292
解释一下 上面的命令 agent 代理模式 -f 指定配置文件 –web 其实是个分隔符等于又启动了一个命令,后面的参数就是开启一个web页面默认端口是9292,这个命令如果拆成两个就是这个样子
java -jar /soft/logstash-1.1.0-monolithic.jar agent -f /soft/redis.conf &
java -jar /soft/logstash-1.1.0-monolithic.jar web –backend elasticsearch:///?local & (其实如果用kibana来做web界面的话这一步完全可以省掉了)
好了,看到9292 端口启动就代表 启动成功了,检查一下
[192.168.233.128 root@nodec:/soft]
# lsof -i:9292
COMMAND PID USER FD TYPE DEVICE SIZE NODE NAME
java 5205 root 465u IPv4 130805 TCP *:armtechdaemon (LISTEN)
其实logstash还启动了一个端口9200,因为启动了内嵌的 elasticsearch,这个9200是 elasticsearch在监听
[192.168.233.128 root@nodec:/soft]
# lsof -i:9200
COMMAND PID USER FD TYPE DEVICE SIZE NODE NAME
java 5205 root 160u IPv4 130682 TCP *:wap-wsp (LISTEN)
现在可以通过浏览器访问一下 http://192.168.233.128:9292 看看logstash是的页面是个什么样子
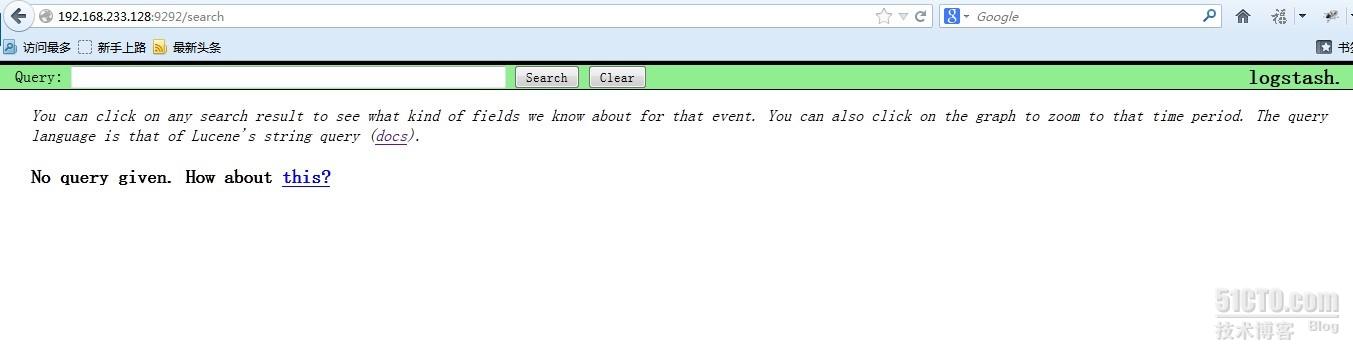
能搜索因为现在还没有数据,其实这个时候 http://192.168.233.128:9200 也是可以访问的,
很多开发自己写代码来调用elasticsearch 来实现他们自己的需要,这里就不多说了
192.168.233.128 这台logstash index的操作暂时告一段落,下面开始配置logstash的agent
登录到 服务器 192.168.233.129 安装基本软件包和logstash
[192.168.233.129 root@noded:~]
# cd /soft/
[192.168.233.129 root@noded:/soft]
# wget http://down1.chinaunix.net/distfiles/jdk-6u13-dlj-linux-i586.bin
[192.168.233.129 root@noded:/soft]
# sh jdk-6u13-dlj-linux-i586.bin
设置 JAVA_HOME
[192.168.233.129 root@noded:/soft]
# vim /etc/profile
export JAVA_HOME=/usr/java
export PATH=$JAVA_HOME/bin:$PATH
export CLASSPATH=.:$JAVA_HOME/lib/tools.jar:$JAVA_HOME/lib/dt.jar:$CLASSPATH
[192.168.233.129 root@noded:/soft]
# yum install ruby
192.168.233.129 root@noded:/soft]
# wget http://logstash.objects.dreamhost.com/release/logstash-1.1.0-monolithic.jar
[192.168.233.129 root@noded:/soft]
# vim redis.conf
input {
file {
type => "producer"
path => "/soft/apache.log"
}
file {
type => "php-log"
path => "/soft/php.log"
}
}
filter {
grep {
match => [ "@message", "mysql|GET|error" ]
}
}
output {
redis {
host => '192.168.233.130'
data_type => 'list'
key => 'logstash:redis'
}
}
大概说一下这个配置文件 input 里的file就是要监视的文件了 这里我监视了两个文件,如果这两个文件有追加的内容就会通过下面的output设置发给 redis服务器
filter 里的grep 意思就是 grep… 后面这段就是 日志内容里面只要有匹配 mysql或GET或error的内容就会被过滤出来,发送到 logstash index
以上就是一个比较简单的配置文件了,让我们启动他
[192.168.233.129 root@noded:/soft]
# java -jar /soft/logstash-1.1.0-monolithic.jar agent -f /soft/redis.conf &
I, [2013-03-19T19:45:35.762000 #2721] INFO — : Using beta plugin 'file'. For more information about plugin statuses, see http://logstash.net/docs/1.1.0/plugin-status {"timestamp":"2013-03-19T19:45:35.752000 -0700","message":"Using beta plugin 'file'. For more information about plugin statuses, see http://logstash.net/docs/1.1.0/plugin-status ","level":"info"}
I, [2013-03-19T19:45:35.778000 #2721] INFO — : Using beta plugin 'file'. For more information about plugin statuses, see http://logstash.net/docs/1.1.0/plugin-status {"timestamp":"2013-03-19T19:45:35.778000 -0700","message":"Using beta plugin 'file'. For more information about plugin statuses, see http://logstash.net/docs/1.1.0/plugin-status ","level":"info"}
I, [2013-03-19T19:45:35.804000 #2721] INFO — : Using beta plugin 'grep'. For more information about plugin statuses, see http://logstash.net/docs/1.1.0/plugin-status {"timestamp":"2013-03-19T19:45:35.803000 -0700","message":"Using beta plugin 'grep'. For more information about plugin statuses, see http://logstash.net/docs/1.1.0/plugin-status ","level":"info"}
I, [2013-03-19T19:45:35.854000 #2721] INFO — : Using beta plugin 'redis'. For more information about plugin statuses, see http://logstash.net/docs/1.1.0/plugin-status {"timestamp":"2013-03-19T19:45:35.853000 -0700","message":"Using beta plugin 'redis'. For more information about plugin statuses, see http://logstash.net/docs/1.1.0/plugin-status ","level":"info"}
只要没有 warning 和 error就算是正常启动了
启动之前请确定 192.168.233.130的 redis服务器已经启动,不然会报错
下面登录到 192.168.233.130 上看看 redis服务的状态
[192.168.233.130 root@nodea:/data/redis/etc]
# lsof -i:6379
COMMAND PID USER FD TYPE DEVICE SIZE NODE NAME
redis-ser 2732 root 4u IPv4 7946 TCP *:6379 (LISTEN)
redis-ser 2732 root 5u IPv4 7963 TCP localhost.localdomain:6379->localhost.localdomain:19214 (ESTABLISHED)
java 2733 root 9u IPv4 7959 TCP localhost.localdomain:19214->localhost.localdomain:6379 (ESTABLISHED)
状态正常,端口处于监听状态,我用的是最简单的 配置,
[192.168.233.130 root@nodea:/data/redis/etc]
# vim redis.conf
#this is the config file for redis
pidfile /var/run/redis.pid
port 6379
timeout 0
loglevel verbose
logfile /data/redis/log/redis.log
dbfilename dump.rdb
dir /data/redis/db/
vm-swap-file /tmp/redis.swap
activerehashing yes
启动命令如下
[192.168.233.130 root@nodea:/data/redis/etc]
# redis-server /data/redis/etc/redis.conf &
下载安装就比较简单了
[192.168.233.130 root@nodea:/soft]
# wget http://redis.googlecode.com/files/redis-2.4.14.tar.gz
[192.168.233.130 root@nodea:/data/redis/etc]
# make –j24
[192.168.233.130 root@nodea:/data/redis/etc]
# make install
配置文件里的那几个路径要提前建好
最后我们回到 logstash agent 上面测试一下
[192.168.233.129 root@noded:/soft]
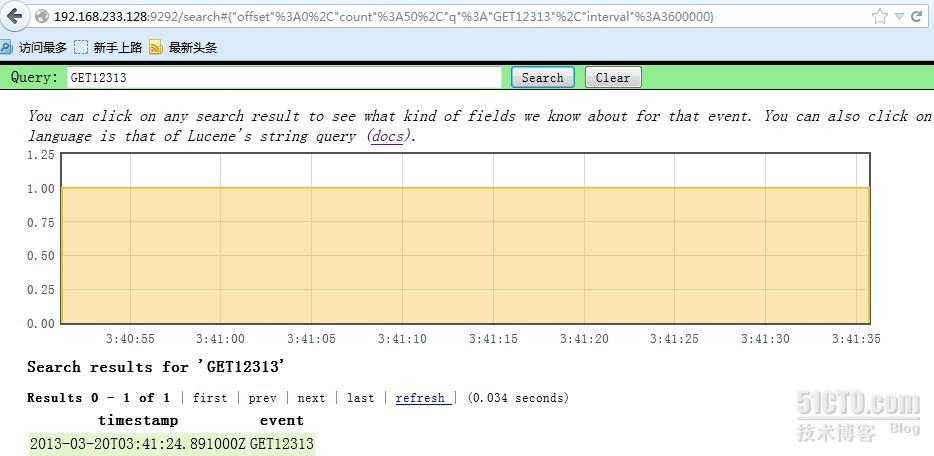
# echo GET12313 >> apache.log
[192.168.233.129 root@noded:/soft]
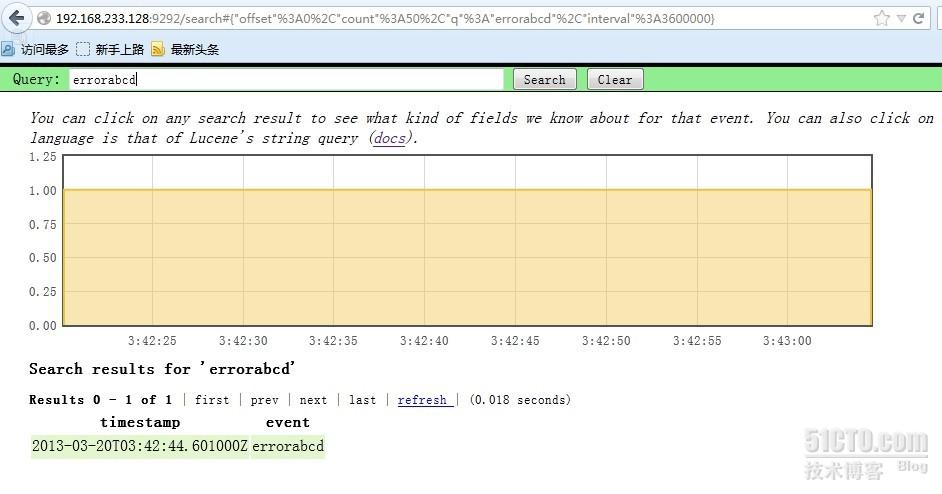
# echo errorabcd >> apache.log
ok 到 http://192.168.233.128:9292 去搜索一下 刚才的两个内容
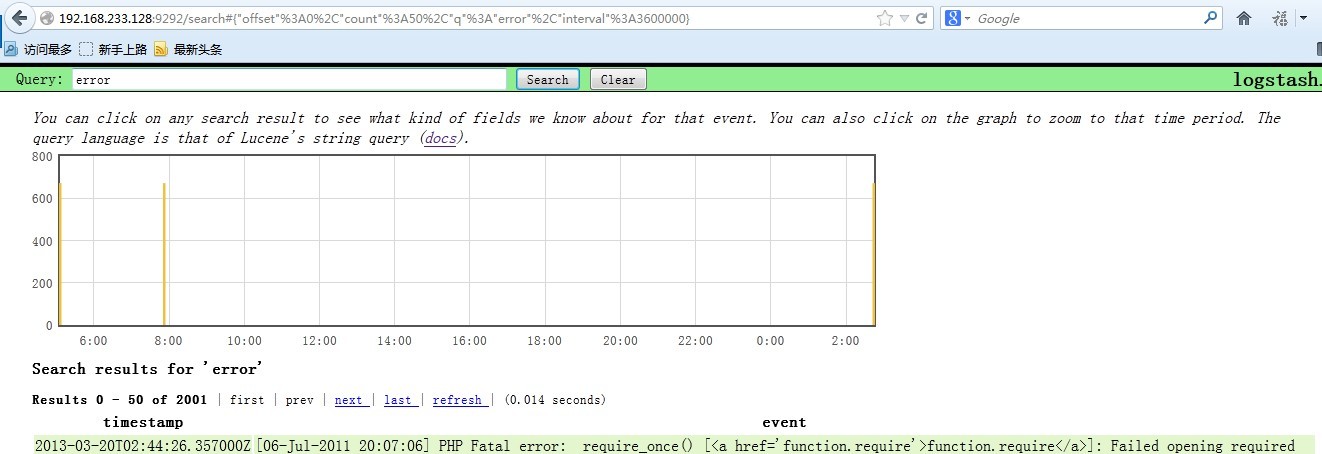
嗯,就是这样了,我现在找个php的错误日志给他追加到php.log文件里
[192.168.233.129 root@noded:/soft]
# cat php-error.log >> php.log
在看看 logstash的页面 搜索一下 error
OK,最后就是 Kibana了 ,我把Kibana装在了 logstash index上面
下载地址为 http://kibana.org/intro.html
[192.168.233.128 root@nodec:/soft] # tar xf Kibana-0.2.0.tar.gz [192.168.233.128 root@nodec:/soft] # cd Kibana-0.2.0 [192.168.233.128 root@nodec:/soft/Kibana-0.2.0] # bundle install 直接安装就好了,非常简单,因为之前咱们已经安装好了 bundle 编辑配置文件,指定 elasticsearch 的位置 [192.168.233.128 root@nodec:/soft/Kibana-0.2.0] # vim KibanaConfig.rb ..... Elasticsearch = "localhost:9200" KibanaPort = 5601 KibanaHost = '0.0.0.0' ..... 主要是这几个参数 启动的话需要ruby [192.168.233.128 root@nodec:/soft/Kibana-0.2.0] # /usr/bin/ruby kibana.rb & [192.168.233.128 root@nodec:/soft/Kibana-0.2.0] # == Sinatra/1.3.5 has taken the stage on 5601 for development with backup from Thin >> Thin web server (v1.5.0 codename Knife) >> Maximum connections set to 1024 >> Listening on 0.0.0.0:5601, CTRL+C to stop 如果ruby的东西都不缺的话,启动会很顺利,ok 现在看看5601端口的状态 [192.168.233.128 root@nodec:/soft/Kibana-0.2.0] # lsof -i:5601 COMMAND PID USER FD TYPE DEVICE SIZE NODE NAME ruby 3116 root 5u IPv4 28947 TCP *:esmagent (LISTEN)
访问一下 试试看 http://192.168.233.128:5601 尝试搜索一下php的错误日志,比如mysql

呵呵,要的就是这个效果,日志会实时的汇总到 logstash index 上供我们查询,当然这只是开始使用logstash的第一步而已,更多的高级功能可以看看官方文档
http://logstash.net/docs/1.1.9/
如果有问题大家可以一起探讨,我也是刚开始接触这个东东,收集日志是相当方便啊,据说还能跟nagios结合. 呵呵
本文出自 “story的天空” 博客,请务必保留此出处http://storysky.blog.51cto.com/628458/1158707